Comprehensive Fitness Business Reporting with Attendlr
Welcome to the Reporting Page of Attendlr, your comprehensive solution for managing and understanding your fitness business’s vital data. In today’s fast-paced and competitive fitness industry, the importance of data-driven decision making cannot be overstated. That’s where our reporting features come in, providing you with critical insights and in-depth analysis to ensure your business’s growth and success.
Attendlr’s advanced reporting capabilities offer an array of features designed to make your data analysis intuitive, effective, and actionable. From revenue per client to event type reports, our platform presents all the key metrics and statistics you need, in an easy-to-understand and accessible format.
Our reporting tools go beyond just presenting data; they provide insights. They help you understand trends, identify opportunities, and make strategic decisions based on solid evidence. Whether you want to analyze your most profitable event types, identify your most loyal clients, or track your business’s overall growth, Attendlr’s reporting features have got you covered.
The following sections delve into the specific reporting features of Attendlr, explaining how each one can provide valuable insights for your fitness business. As you explore, remember that these features are all interconnected, working together to give you a holistic view of your business’s performance.
Embrace the power of data with Attendlr, and let’s take your fitness business to new heights. Enjoy the journey of discovery that awaits you.
Revenue per Client
Available IN ALL PLANS
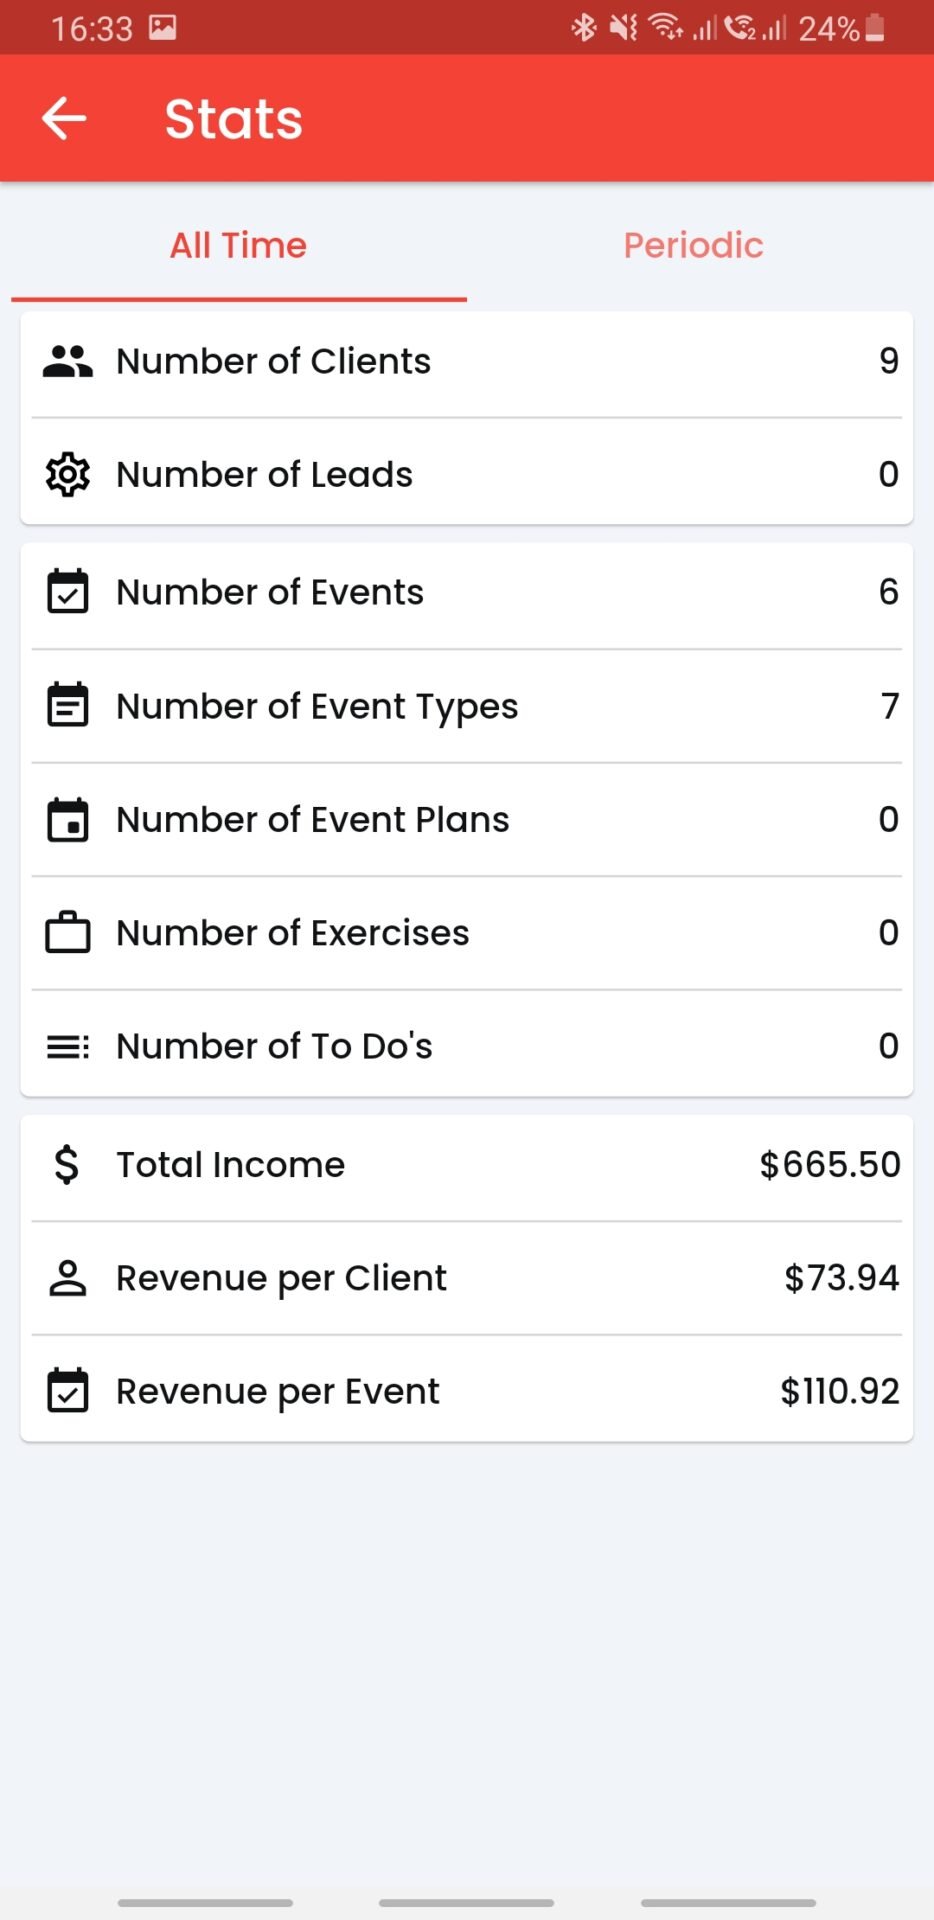
Attendlr’s Revenue Per Client feature is a powerful tool that gives you insight into the financial value each client brings to your fitness business. By providing a clear view of the income generated by each client over time, it essentially gives you an understanding of their customer lifetime value (CLV). CLV is a critical metric in business analytics as it helps in assessing the profitability of your clientele.
Knowing each client’s revenue contribution allows you to make more informed decisions about resource allocation for customer retention versus acquisition. It can guide your marketing strategies, informing where to place efforts to maximize ROI. Whether you want to identify your most valuable clients or understand the financial impact of your client churn rate, the Revenue Per Client feature is indispensable. Gain deeper insights into your clients’ financial contribution and use that knowledge to build a more profitable, sustainable fitness business with Attendlr.

Revenue per Event

Available IN ALL PLANS
Attendlr’s Revenue Per Event feature offers invaluable insights into the financial performance of each event you conduct. This comprehensive tool not only tracks the revenue generated by individual events but also presents a breakdown of the contributing factors, such as the number of participants, ticket prices, and additional purchases made during the event.
Having this level of financial granularity at your fingertips helps you analyze and compare the profitability of different event types, formats, or instructors, providing you with a data-driven foundation to make strategic decisions about your future event planning. You can identify which events are the major drivers of your revenue growth and understand the variables contributing to their success.
The Revenue Per Event feature also aids in identifying potential areas for improvement. For instance, if certain events are consistently underperforming, you can investigate the factors involved and make necessary adjustments. Conversely, high-performing events can be replicated or modified to further enhance revenue generation.
Overall, this feature empowers you to optimize your event portfolio, aligning it more closely with your clients’ preferences and your business’s profitability goals. Turn your event data into actionable insights and build a more prosperous fitness business with Attendlr’s Revenue Per Event feature.
Basic Stats
Available From Basic Plan
With Attendlr’s Basic Stats feature, you have access to a concise and consolidated snapshot of your fitness business’s vital statistics. This feature gives you a comprehensive overview of your operational metrics, including the total number of clients, events held, and the overall revenue earned. It’s a quick yet powerful way to keep a finger on the pulse of your business.
The data provided by Basic Stats is instrumental in evaluating your business’s performance at a glance and serves as a foundation for more in-depth analysis. You can monitor the rate of client growth, identify patterns in event attendance, and track revenue trends over different periods. This information is key to understanding the dynamics of your business and guiding your strategic planning.
The Basic Stats feature is not just about numbers. It’s about transforming these numbers into insights that can help drive your business forward. By closely monitoring these basic metrics, you can quickly identify both challenges and opportunities. For instance, a sudden drop in client numbers may indicate a problem with client retention, while an increase in event attendance might highlight a successful marketing campaign.
From establishing your daily operational baseline to aiding in annual strategic reviews, the Basic Stats feature is an essential tool for any fitness business owner. Utilize it to stay informed, make data-driven decisions, and ultimately steer your business towards growth and success.

Daily, Monthly & Yearly Reports

Available From PRO Plan
In addition to providing a broad overview, Attendlr’s time-specific reporting allows you to delve deeper into your business data. The ability to generate daily, monthly, or yearly reports gives you the flexibility to examine your operations from different perspectives and time scales. This helps you identify patterns, cycles, and trends that might be invisible over shorter or longer periods.
For instance, daily reports can provide immediate feedback on recent changes or initiatives, enabling rapid response and adaptation. Monthly reports might reveal patterns connected to pay cycles or seasonal factors, while yearly reports provide a high-level view of your business’s overall trajectory and growth.
These time-specific reports aren’t just about tracking your past performance; they are powerful predictive tools as well. By studying the patterns and trends in these reports, you can forecast future performance and make strategic decisions to steer your business towards desired outcomes. Whether you’re planning for the next quarter or preparing for the next year, these reports provide the data-driven insights you need to make informed decisions.
Harness the power of time-specific reporting with Attendlr and get a clearer understanding of your fitness business’s past, present, and future performance.
Bar Charts
Available From PRO Plan
The Bar Charts feature in Attendlr is an invaluable tool that simplifies data analysis by converting complex datasets into clear and understandable visuals. Instead of combing through endless rows and columns of numbers, you can glance at a bar chart and quickly grasp the information it presents. By translating your raw data into intuitive graphical representations, this feature not only enhances comprehension but also saves time.
Bar charts provide a more impactful and immediate understanding of trends, patterns, and outliers. Whether it’s comparing the performance of different events, tracking client attendance over time, or analyzing revenue trends, bar charts make these analyses significantly more straightforward. They allow you to quickly spot increases, decreases, and periods of stagnation in any given metric.
Furthermore, these visual representations are not just easier to understand; they also provide an effective means of communication. You can use the generated bar charts in presentations, reports, or discussions with stakeholders to clearly articulate your business’s performance and future projections. They effectively communicate complex data in a simple, accessible way.
But beyond just understanding the present, bar charts can also help you plan for the future. By making it easy to identify patterns and trends, they provide a solid basis for prediction and forecasting. You can use these insights to craft evidence-based strategies and make informed decisions that align with your business’s growth trajectory.
In short, the Bar Charts feature in Attendlr takes the hassle out of data analysis. It offers you a fast, efficient, and effective way to understand your business data, supporting you in making strategic decisions that drive your fitness business forward.

Cumulative Charts

Available From PREMIUM Plan
Attendlr’s Cumulative Charts feature is an invaluable asset for visualizing and understanding your business’s long-term growth and progress. By aggregating your data over time, these charts offer a comprehensive view of your performance in different areas, whether it’s client growth, revenue generation, or event attendance.
Unlike other chart types that focus on individual data points, cumulative charts highlight the overall trend and direction of your data. This makes them particularly useful for tracking progress towards long-term goals or milestones. You can easily see whether your business is on an upward trajectory and how fast it’s growing, which is essential information for future planning and strategic decision-making.
One of the key strengths of cumulative charts is their ability to reveal patterns that might be overlooked in a standard bar or line chart. They can highlight periods of accelerating growth or identify when progress has slowed or plateaued. This information is vital in understanding the effectiveness of your strategies and initiatives and can guide adjustments to keep your business on track.
In addition, cumulative charts provide a clear and impactful way to communicate your business’s progress to stakeholders. They offer a compelling visual narrative of growth and success that can be understood at a glance. Whether you’re sharing updates with your team, investors, or clients, a cumulative chart can tell a powerful story about your business journey.
Overall, the Cumulative Charts feature in Attendlr offers you a unique perspective on your business data. It helps you focus on the big picture, understanding your overall progress and long-term growth trends. Harness the power of cumulative charts to monitor your progress, guide your strategic planning, and drive your fitness business towards continued success.
Pie Charts
Available From PREMIUM Plan
Pie Charts are another valuable visualization tool that Attendlr provides to simplify and enhance your data analysis. They are particularly useful for understanding the proportion of different categories within your total data set. By transforming numerical data into visual segments, pie charts give you a quick and clear picture of the relative sizes of different categories.
Pie charts are perfect for examining the distribution of various elements within your business. For instance, you might use them to analyze the share of revenue that comes from different event types or membership tiers. Similarly, pie charts can help you understand client demographics, showing the proportions of different age groups, fitness levels, or membership durations in your client base.
These charts enable you to quickly identify which segments are contributing most to your success and which might need more attention. For example, if a pie chart of revenue sources shows a large segment for one particular event type, it indicates that this event is highly successful and perhaps deserving of more resources. On the other hand, a smaller segment might reveal an underperforming event that needs rethinking or revitalizing.
Pie charts can also help identify opportunities for improvement or expansion. A segment that’s smaller than expected could indicate an area where your business could do better. For instance, if a certain demographic is underrepresented in your client base, it might suggest a potential market for you to target.
Moreover, pie charts can be powerful communication tools. They offer a straightforward, visually engaging way to present data to your team, stakeholders, or clients. The proportions and contrasts between the segments can tell a clear story, whether it’s about your business’s success in serving a diverse client base or the profitability of different event types.
In conclusion, Attendlr’s Pie Charts feature is a vital tool for effective data analysis and decision-making. By providing a clear visual breakdown of proportions and relationships, it offers insightful perspectives that can guide your strategic planning and contribute to your fitness business’s continued growth and success.

Event Type Reports

Available From PREMIUM Plan
Attendlr’s Event Type Reports feature is a powerhouse tool designed to provide you with detailed insights into the performance and popularity of different types of events you offer. Whether your roster includes yoga classes, HIIT workouts, wellness workshops, or strength training sessions, this feature can help you uncover which events are performing exceptionally and which ones may need reevaluation.
The strength of the Event Type Reports lies in its ability to drill down into specific details of each event type. It goes beyond just raw attendance numbers. It takes into account factors such as the revenue generated from each event, the number of repeat attendees, and the resources required for each event. By analyzing these metrics, you can gauge the overall profitability and success of your various event types.
These reports also provide a useful perspective on your clients’ preferences. For example, if your yoga classes consistently attract more clients and generate more revenue than other events, it’s clear that these classes are highly valued by your client base. On the other hand, if your wellness workshops aren’t drawing as many clients, it might be time to rethink their content, scheduling, or marketing.
Furthermore, these reports can play a crucial role in strategic planning for your business. Understanding which events are most successful and popular can inform decisions about where to allocate resources. If a certain event type is consistently well-attended and profitable, it might be worth investing more in its expansion, offering more sessions, or developing additional similar events.
On the flip side, these reports can also highlight areas for improvement. If some events aren’t performing as well as expected, it may signal the need for changes – whether in terms of the event’s format, timing, promotion, or even the instructor.
In conclusion, Attendlr’s Event Type Reports feature offers an in-depth understanding of the performance of your different event types. This knowledge is key to optimizing your service mix, meeting your clients’ needs, and ensuring your business’s continued growth and success. Harness the power of Event Type Reports to make data-driven decisions and strategies that align with your clients’ preferences and your business goals.
Ticket Type Reports
Available From PREMIUM Plan
Attendlr’s Ticket Type Reports feature is an indispensable tool for understanding the dynamics of your ticket sales and their impact on your bottom line. This feature gives you a detailed breakdown of the popularity and profitability of different ticket types you offer, whether that’s single-event tickets, multi-event passes, monthly memberships, or any other ticket option. These insights not only provide you with a clear snapshot of your ticket sales performance but also help you strategize your pricing model for optimized revenue.
Understanding which ticket types are most popular among your clients can inform many facets of your business strategy. If certain ticket types consistently outperform others in terms of sales, this indicates a preference among your clients. Knowing this, you can adjust your offerings, marketing efforts, or even your scheduling to better cater to these preferences. For instance, if multi-event passes are the most popular, you might consider offering a wider variety of multi-event packages to meet this demand.
Equally important is the profitability analysis of different ticket types. While some ticket options might sell more, they might not necessarily be the most profitable. The Ticket Type Reports feature provides you with detailed financial insights, helping you understand the revenue contribution of each ticket type. This can inform decisions about your pricing structure, allowing you to tweak prices or offer promotions for certain ticket types to maximize your profits.
Moreover, these reports can assist in spotting trends and patterns over time. You could track the sales of different ticket types seasonally, which can inform your promotional or pricing strategies during peak and off-peak periods. This knowledge can empower you to make proactive changes and stay ahead of the curve.
In conclusion, the Ticket Type Reports feature of Attendlr is crucial in unveiling the sales and profitability of your various ticket offerings. It equips you with the knowledge to refine your pricing strategy, align your offerings with client preferences, and ultimately drive your revenue growth. Harness the power of Ticket Type Reports to make data-driven decisions and build a profitable ticketing strategy that meets your clients’ needs and boosts your business success.
